Customization and Preferences
Content
User specific preferences and settings
The settings file IA_preferences.xml
Default directories
Default settings for database access
Debug and trace
Activating and hiding functional modules
Customizing the workbench appearance
Application name, copyright, license agreement, icons
Look and feel
Color palettes
Labels, dialog texts and tool tips
User specific preferences and settings
This chapter describes how Synop Analyzer can be configured towards the needs of single users by defining user-specific settings in the preferences file IA_preferences.xml.
The settings file
IA_preferences.xml
Synop Analyzer stores and reads more than a hundred settings, default values and customization parameters in a preferences file named IA_preferences.xml residing in the root directory of the Synop Analyzer installation. This file is an XML document conforming to the XML schema
http://www.synop-systems.com?/xml/InteractiveAnalyzerPreferences.xsd.
The structure of the document is quite simple: it consists of a series of tags of the form
<Setting name="…" type="…" module="…" value="…"
default="…"/>,
for example
<Setting name="smallIcon" type="filename" module="GUI"
value="IA_icon32x32.gif" default="IA_icon32x32.gif"/>.
name
is the name of the parameter to be defined, type is its data type (int, double, free textual string, file name, or choice list). module states the functional modules for which the parameter applies and value is the actual value of the parameter.
The attribute default is ignored when Synop Analyzer parses the preferences file. It serves to memorize the default setting of the parameter at the installation time of the software and helps undoing changes which lead to surprising effects or errors.
If you remove the file IA_preferences.xml, Synop Analyzer generates a new version of the file in which all parameter values are identical to the default values.
As a user of the software you can work with your own version of IA_preferences.xml. For example, you can copy the original file to your home directory and rename it, e.g. to c:\users\smith\IA_preferences_smith.xml. Then you write and save a batch file, e.g. c:\users\smith\my_IA.bat which calls Synop Analyzer with the name of the new batch file as (second) command line parameter. (The first command line parameter, which contains the analysis task to be executed automatically on program startup, can remain empty.) The batch file should look like this:
c:/IA/SynopAnalyzer.bat "" c:/users/smith/IA_preferences_smith.xml
.
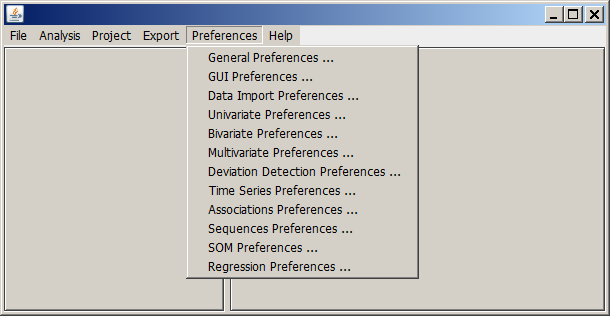
You can modify the parameters in IA_preferences.xml by directly editing the file using an arbitrary text editor. You can also customize IA_preferences.xml by means of the menu button Preferences in the main menu of the Synop Analyzer graphical workbench.
Default directories
The following parameters in IA_preferences.xml specify default directory paths:
- defaultTempDirectory
defines the directory which will be used by Synop Analyzer as temporary 'RAM disk' while reading and compressing large data files.
- defaultResultDirectory
defines the default directory for storing analysis results such as generated mining models or analysis task descriptions in XML format.
- defaultInputFileDirectory
defines the default directory in which flat file input data to be opened in Synop Analyzer are expected to reside.
- defaultInputSpreadsheetDirectory
defines the default directory in which MS Excel or other OOXML format spreadsheets to be opened in Synop Analyzer reside.
Default settings for connections to relational databases
The following parameters in IA_preferences.xml specify default settings for reading data from relational databases:
- defaultDBMS
specifies the default relational database management system (DBMS). Possible values are
Oracle, MySQL, Postgres, SQLServer, Access, DB2, Sybase, Teradata, Progress and ODBC. The latter specifies Sun's generic ODBC-JDBC bridge.
- defaultDBServer
defines the server name of the default database server. Use
localhost of you primarily work with databases and DBMS installed on your local computer.
- defaultDBUser
default database user name to be used for logging in to the database server.
- defaultDataBase
defines the name of the default database.
- defaultDBSchema:
here, you can specify the name of a database schema in which most of the tables to be analyzed reside. If you always work with one single table, you can also specify
[schema_name].[table_name] here.
Debug and trace
The following parameters specify settings for debug and trace. These settings define up to which extent Synop Analyzer produces progress, error and warning information while processing analysis tasks, or while your are interactively working with the graphical workbench. This information can be helpful to track down problems or unexpected program behavior.
- traceFile:
per default, Synop Analyzer writes progress information to the standard console output ('stdOut'). You can redirect trace output into a file by specifying a file name here.
- traceLevel
defines the amount of information to be written. Allowed values range from 0 to 3. 0 means that no trace messages are produces as long as no unexpected error occurs or a predefined task could not be executed properly. 3 means that a lot of detailed trace information is produced for each single analysis step, both in the case of an error and in the success case. In trace level 3, the trace file can become very large when running complex tasks on large input data. Use level 3 only temporarily, in order to track down a specific problem, but not permanently in normal operation mode.
Hiding modules
If you or the users for whom you are customizing the software are expected to use only a limited subset of all functional modules offered by Synop Analyzer, you can hide certain modules. This makes the workbench less complex and easier to use since many buttons and expert parameter input fields might disappear from the graphical user interface (GUI).
You can hide modules by setting one or more of the following parameters in IA_preferences.xml to "false":
- activateGUI:
if this parameter is "false", only the command line processor sacl.bat, but not the graphical workbench can be used.
- activateCommandLine:
if this parameter is "false", only the graphical workbench SynopAnalyzer.bat, but not the command line processor (and as a consequence no automated task processing in batch mode) can be used.
- activateDatabaseAccess:
if this parameter is "false", data import from relational databases is impossible.
- activateSpreadsheetImport:
if this parameter is "false", data import from MS Excel is impossible, and the import wizard for transforming data from spreadsheets with a complex structure into a flat tabular form is not available.
- activateDataPreparation:
if this parameter is "false", the data preprocessing functions such as filter, collate, sort, compute fields, pivot/unpivot are unavailable.
- activateUnivariateExploration:
if this parameter is "false", no univariate data exploration, value distribution histograms and data field statistics can be performed.
- activateBivariateExploration:
switches on/off the bivariate exploration module.
- activateMultivariateExploration:
switches on/off the multivariate exploration module.
- activateTestControlVerification:
switches on/off the module for comparing a test and a control data set and for verifying hypotheses concerning differences between the test and the control data.
- activateCorrelations:
switches on/off the module which calculates correlations between data fields.
- activateDeviations:
switches on/off the module which finds deviations and presumable data inconsistencies
- activateTimeSeries:
switches on/off the module for time series analysis and forecast.
- activateAssociationsTrain:
switches on/off the associations analysis module.
- activateSequencesTrain:
switches on/off the sequential patterns analysis module.
- activateSOMTrain:
switches on/off the neural networks module 'SOM' (self organizing maps) for clustering, classification, prediction and deviation detection.
- activateRegressionTrain:
switches on/off the linear regression module
Note: if some of the modules are deactivated in the initial version of IA_preferences.xml, then your license does not enable you to use the modules. In this case, setting the corresponding 'activate...' parameter to "true" has no effect.
Customizing the workbench appearance
This chapter describes how the graphical appearance and the textual labels of the Synop Analyzer workbench can be modified. The description is targeted at
-
End users who want to personalize the appearance and the look and feel of the software to match their personal preferences.
-
System integrators who are integrating Synop Analyzer in an existing BI software stack and who want the integrated solution to have a uniform color scheme and look and feel.
-
OEM partners who are building their own software solutions using Synop Analyzer components.
Technically, the custimizations described here are effectuated by modifying two XML resource files which come with the Synop Analyzer software:
-
The preferences file
IA_preferences.xml,
-
The textual resource file IA_texts.xml or a renamed and customized substitute for that file which is referenced in the following settings parameter of the preferences file IA_preferences.xml:
<Setting name="textualResourceFile" type="filename" module="all" value="c:\users\smith\my_personal_IA_texts.xml" default="IA_texts.xml"/>.
Application name, copyright, license agreement, icons
The file IA_preferences.xml contains 5 parameters which control the application name, the application icon, the copyright statement and the short version of the license agreement which is printed at the beginning of the Synop Analyzer trace file.
These parameters, and the possibility to freely access and modify them in the XML file, are targeted at OEM partners who are integrating the Synop Analyzer software into their own software offerings which are sold under the partner's own label, copyright and icon. Note that these entries in the preferences file are matched against the Synop Analyzer license key when the software is started. The software will issue an error message and terminate if the entries found in the preferences file do not match the available license key.
These are the 5 mentioned settings and their default values:
-
<Setting name="application" type="string" module="all" value="Synop Analyzer"/>
-
<Setting name="copyright" type="string" module="all" value="(C) 2012, 2013 Synop Systems UG (haftungsbeschr?nkt)"/>
-
<Setting name="licenseAgreement" type="string" module="all" value="Free trial version of Synop Analyzer.\nDisclaimer: The author of this software accepts no responsibility for\ndamages resulting from the use of this product and makes no warranty\nor representation, either express or implied, including but not limited\nto, any implied warranty of merchantability or fitness for a particular\npurpose. This software is provided 'AS IS', and you, its user, assume\nall risks when using it."/>
-
<Setting name="smallIcon" type="filename" module="GUI" value="IA_icon32x32.gif"/>
-
<Setting name="largeIcon" type="filename" module="GUI" value="IA_icon64x64tr.gif"/>
Look and feel
Synop Analyzer supports 3 different 'look and feel' (LAF) modes
-
the 'Windows' look and feel,
-
the 'Java native' or 'Metal' look and feel,
-
the 'Motif' look and feel which is familiar to users of X11 GUIs under UNIX/Linux operating systems.
The default setting is 'Windows'. You can activate one of the other 'LAF's by modifying the following entry in your preferences file (IA_preferences.xml):
   <Setting name="lookAndFeel" type="choice" module="GUI" value="windows"

     choices="metal|motif|windows"/>
.
Color palettes
For all Synop Analyzer workbench panels which show colored charts and other data visualizations, the preferences file IA_preferences.xml contains color palette settings which can be modified in order to match the user's or partner's preferences.
For the 'Statistics and Distributions' panel, the following color parameter is available:
-
<Setting name="barColors" type="string" module="UnivarStats" value="0:0:255 255:0:0 0:255:0 255:255:0 0:255:255 255:0:255 192:192:192 255:128:0 0:255:128 128:0:255 128:255:0 0:128:255 255:0:128 128:128:128"/>.
Each number triple separated by colons represents one RGB color code with R (red), G (green) and B (blue) values in the range 0 to 255. The first triple specifies the color of the first histogram bar - in the setting shown above, an intense blue - the second triple represents the second histogram bar, and so on.
For the 'Bivariate Exploration' panel, the following color parameters are available:
-
<Setting name="histogramBarColor1" type="string" module="BivarStats" value="0:0:255"/>.
This RGB color code specifies the color of the first, third, fifth, etc. range defined by clicking on the selector bars on the left hand part of the panel.
-
<Setting name="histogramBarColor2" type="string" module="BivarStats" value="255:0:0"/>.
This RGB color code specifies the color of the second, fourth, sixth, etc. range defined by clicking on the selector bars on the left hand part of the panel.
-
<Setting name="circleColor" type="string" module="BivarStats" value="0:0:255"/>.
This RGB color code specifies the color of the circles in the circle plot on the right hand part of the panel.
For the 'Multivariate Exploration' and the 'Test/Control Analysis' panel, the following color parameters are available:
-
<Setting name="histogramBarColorSelected1" type="string" module="MultivarStats" value="0:0:255"/>>.
The RGB code of the histogram bars representing the selected data subset respectively the test data subset.
-
<Setting name="histogramBarColorSelected2" type="string" module="MultivarStats" value="255:64:64"/>>.
The RGB code of the histogram bars representing the control data subset in the Test/Control Analysis panel.
<Setting name="histogramBarColorAll" type="string" module="MultivarStats" value="220:255:220"/>>.
The RGB code of the histogram bars representing the entire data (background distribution).
<Setting name="selectedTitleColor" type="string" module="MultivarStats" value="0:0:255"/>>.
The RGB code specifying the color of the histogram title texts for those histograms in which the user has performed data selections by clicking on the checkbox selector bars below the chart.
Labels, dialog texts and tool tips
All labels, panel titles, message or tool tip pop-up texts appearing in the Synop Analyzer workbench are defined in the textual resource file IA_texts.xml or a renamed and customized substitute for that file.
The textual resource file is an XML document conforming to to the XML schema
http://www.synop-systems.com?/xml/InteractiveAnalyzerTexts.xsd.
The structure of the document is quite simple: it consists of a series of tags of the form
<Label key="…" inGlossary="…">
<Modules> … </Modules>
<Value text="…" lastModified="…" lang="…" target="…"/>
<Description text="…" lastModified="…" lang="…" target="…"/>
</Label>.
The various parts of the <Label> tag have the following meaning and functions:
- key
is the name under which the label is referenced in the program code. You must never change the
key attribute!
- inGlossary
specifies whether or not the automatically generated glossary helpGlossary.html should contain an entry for the current label.
- <Modules>
contains a space separated list of the modules or panels in which the label appears.
- <Value text="…" lang="…" … />
contains the text which actually represents that label on the panel when the language
lang is active.
-
The optional sub-element <Description text="…" lang="…" … /> contains the text which pops up as a tool tip if the mouse pointer is placed on the GUI element carrying the current label. Furthermore, this text appears in the glossary entry created for the label.
The sub-elements <Value> and <Description> contain an optional attribute target. This attribute specifies the application name for which the current label text or label description is being defined. Using this attribute, OEM partners can overwrite any textual resource of Synop Analyzer when embedding Synop Analyzer components into their own applications.
Let us look at an example. The Undo button in the Test/Control Analysis panel has the following default entry in
IA_texts.xml:
<Label> inGlossary="true" key="Undo">
<Modules>TestControlSplit</Modules>
<Value text="Undo" lastModified="2010-03-01" lang="en_US"/>
<Description text="Undo the previous control data optimization.
That means, reactivate all available control data records."
lastModified="2010-03-01" lang="en_US"/>
</Label>
The OEM partner offering an application called 'XY Explorer' could modify this label as follows:
<Label> inGlossary="false" key="Undo">
<Modules>TestControlSplit</Modules>
<Value text="Undo" lastModified="2010-03-01" lang="en_US"/>
<Value text="Alle" lastModified="2010-04-25" lang="de_DE"
target="XY Explorer"/>
<Description text="Undo the previous control data optimization.
That means, reactivate all available control data records."
lastModified="2010-03-01" lang="en_US"/>
<Description text="Wähle alle verfügbaren Kontrolldaten aus."
lastModified="2010-04-25" lang="de_DE" target="XY Explorer"/>
</Label>
The effect of the change is that the German localization of 'XY Explorer' will use a customized button label and button tool tip (whereas all non-German localizations of 'XY Explorer still use the default label texts and tool tips). Furthermore, the entry for 'Undo' is removed from 'XY Explorer's glossary.
When customizing textual resources, there's no need to redefine all labels or all languages. Whenever you do not provide a customized version, the best matching generic version of the label will be used. That means, if a default version for the currently active language exists, the language specific default version, otherwise the "en_US" default version.