|
||||||||
| FRAMES NO FRAMES | ||||||||
Concept
A sample use case
The Visual Report Designer
Using Stylesheets
Creating HTML or PDF Reports
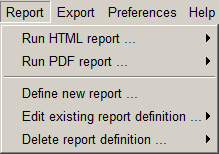
The reporting functions of Synop Analyzer are started from the main menu item
Generating reports involves two steps, which can be performed by different people: first you define a report template, then (and maybe repeatedly at later times) you create the HTML or PDF report itself by 'running' a predefined report template on the current data available at that time. Report templates can be run from the graphical workbench but also in an automatic mode using the Synop Analyzer command line processor.
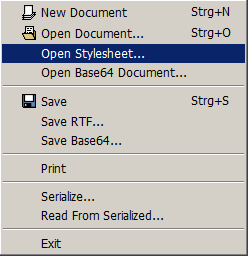
The picture below shows the different features of the menu item
The three menu items below the horizontal separator line serve to create, edit or delete report templates. The two menu items above the separator create a HTML or PDF report out of a report template, taking the currently available in-memory data within Synop Analyzer to fill the place holders in the template with up-to-date charts, tables and figures.
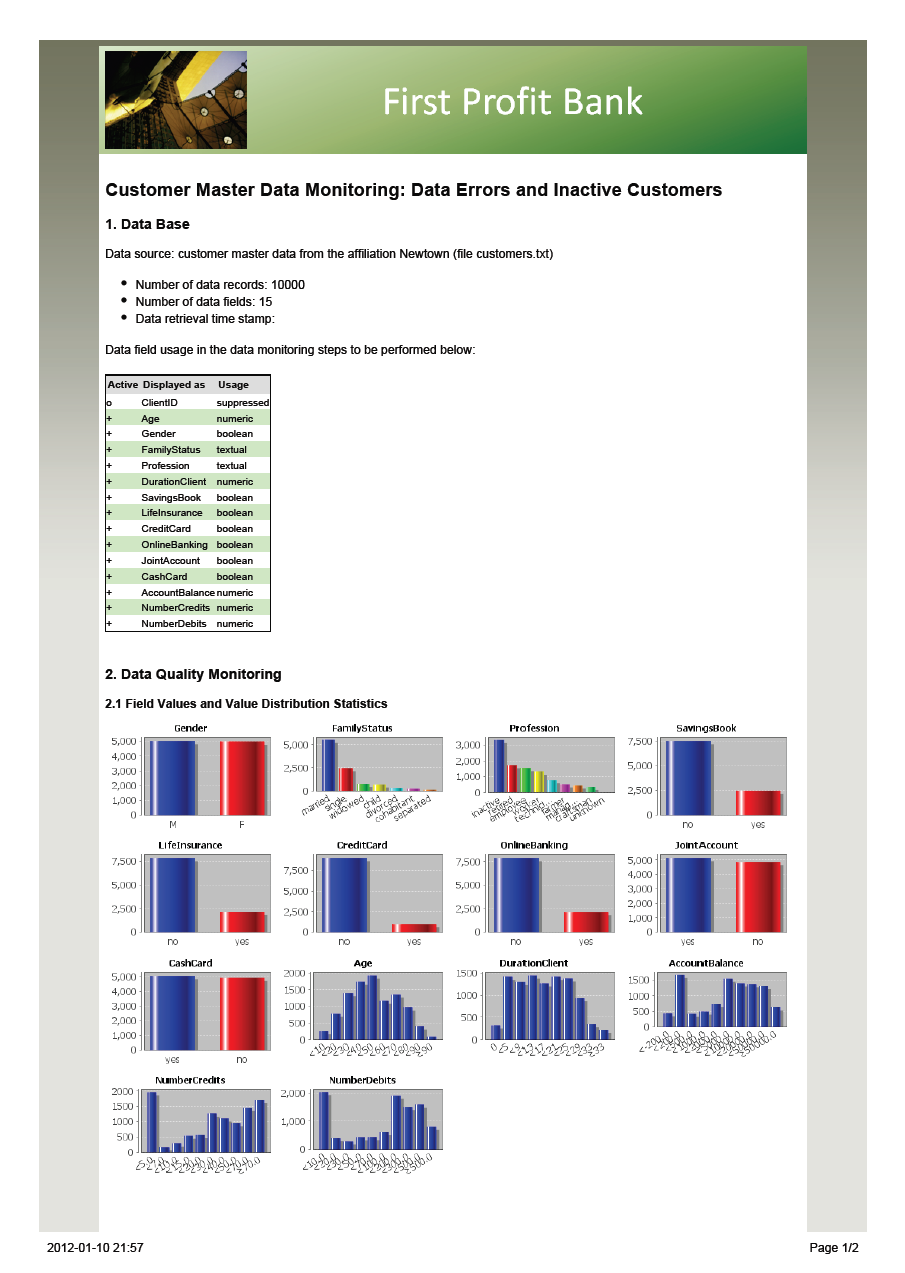
The whole workflow from defining and refining a report template, linking an external CSS stylesheet up to creating the final report shall be demonstrated at hand of a simple example. In the example, we assume that the sample data doc/sample_data/customers.txt are the customer master data of the Newtown affiliation of Frist Profit Bank, and that these data are to be monitored and quality assured once a year. The goal of the monitoring is to detect presumable data errors and to identify inactive customers. The results are to be documented in an 'revision safe' manner in the form of PDF documents which will be stored in a repository. Furthermore, we assume that First Profit Bank has a corporate design template for its official online and printed documents, a CSS stylesheet named doc/sample_data/report_stylesheet.css. This stylesheet is to be used for formatting our report.
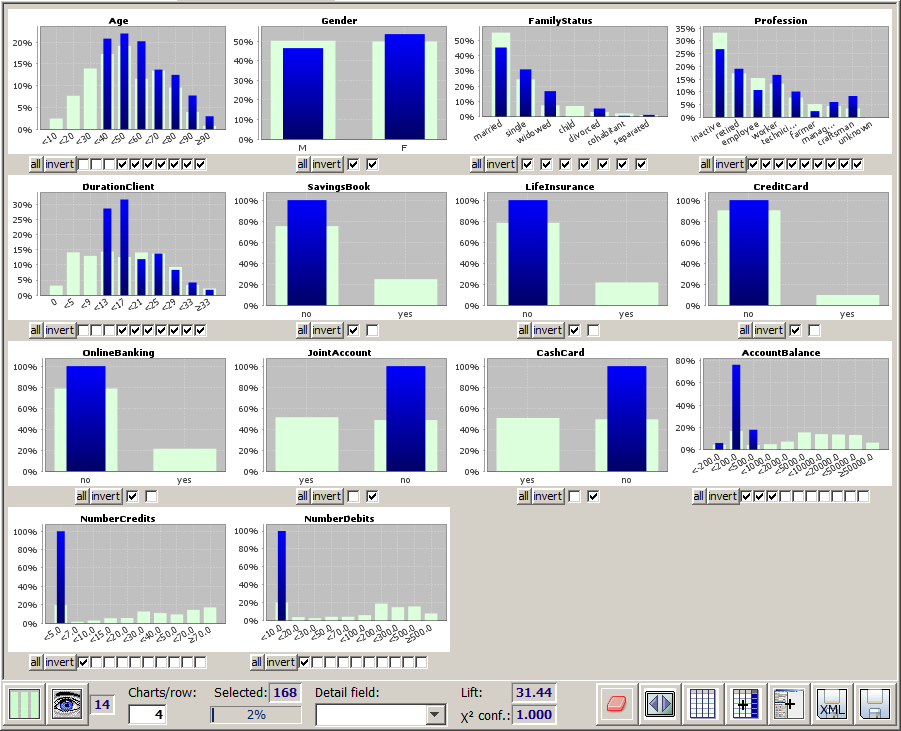
The desired analysis tasks of our example can be performed by loading the data doc/sample_data/customers.txt into Synop Analyzer and by opening three analysis tabs on them:
You can load all these analysis tasks and tabs via the main menu item
Via
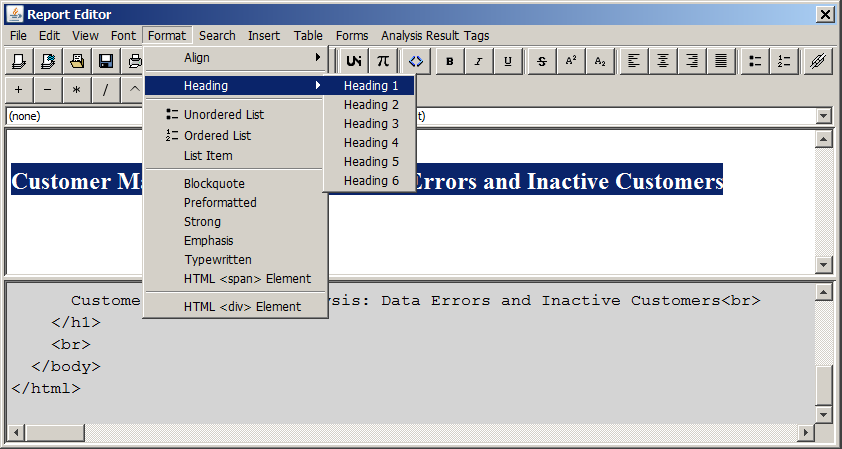
In the screenshot shown below, we have typed in the desired head line of the report; then we have formatted the head line using the editor menu item
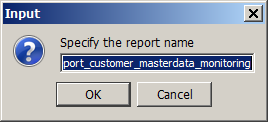
Once a report template has been created, you can leave the report editor by simply closing the editor window. A pop-up dialog will appear which asks for a name for the newly created report template:
Attention: When you leave the report editor and specify a name for the new report template, the template is stored in-memory as a part of the currently opened Synop Analyzer project. You have to save the project via
The report editor offers several functions beyond the scope of a word processing program. In particular, it has the ability of placing links to charts, tables and figures which appear in the currently opened input data tabs and data analysis tabs within the Synop Analyzer GUI. The link is not a hard link which just copies the current content of the link destination. Instead, this copying action is only performed when the report template is 'executed' and a final HTML or PDF report is created from it. That means, when you 'run' the report template in the future, the resulting report will always reflect the must up-to-date data. The editor's menu item
Attention: Some of Synop Analyzer's analysis modules, for example the module 'Deviations and Inconsistencies' which we have used in our example, do not automatically create their analysis results when the panel is opened. Instead, a button such as
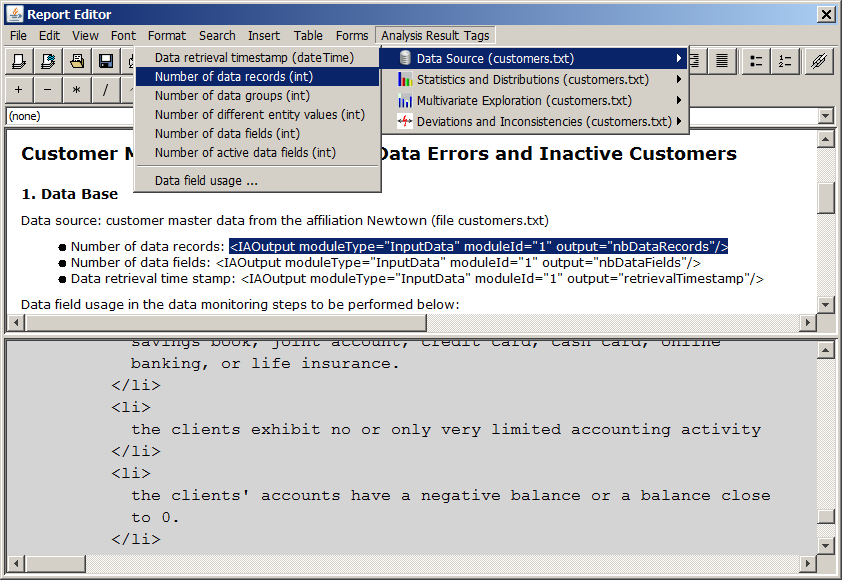
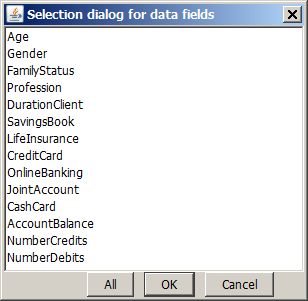
The screenshot displayed below shows all possible results which can be embedded in a report from an input data tab:
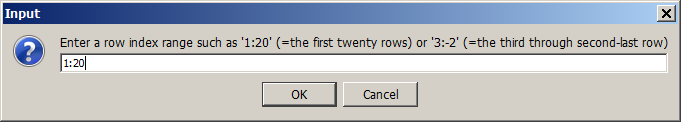
The embedded links appear within the report template in the form of tags starting with code><IAOutput .../>. Some embedded links require further specifications. The editor asks for these additional settings by means of pop-up dialogs. For example, when linking to a table, the question pops up which table rows and which table columns are to be shown, and in which order. In the screenshot shown below, we have specified that not more than the first 20 rows of the table are to be shown in the report.
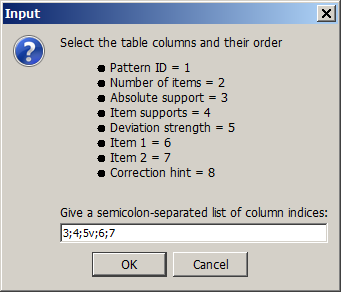
Another pop-up dialog asks for a column selection and whether the table rows are to be sorted by ascending or descending values of a certain table column.
In the dialog shown below, we have specified that only the table columns 3 to 7 (in this order) are to be displayed in the report. The table rows are to be sorted by descending values of column 5. This is specified by the character 'v'; ascending ordering would have been specified by the 'circumflex' character, that means the letter 'v' rotated by 180 degrees.
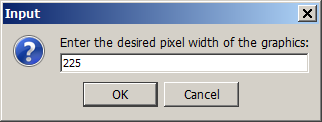
For graphical results you have to specify the desired width (in pixels):
For series of graphical outputs one can specify the subset of the series to be displayed in the report:
Using predefined layouts and stylesheets in a report template is possible by embedding an external CSS stylesheet into the report template. This is done in the report editor via the menu item
In our example, we use the predefined stylesheet doc/sample_data/report_stylesheet.css.
Achtung: most stylesheets divide the available space on each screen page in different areas called 'divisions' which are specified using the HTML tag <DIV .../>. the stylesheet doc/sample_data/report_stylesheet.css, for example, expects that the main part (<BODY>) of the HTML document is divided in the following divisions:
<DIV id="container">

  <DIV id="header"></DIV>

  <DIV id="main_part">

    ...(the report content must appear here)...

  </DIV>

</DIV>
These <DIV>-Elements can be added to the report template using the menu item <DIV> tags to the report template by editing the XML project file which contains the report template using an arbitrary XML editor.
There are some preference settings for reports. They can be modified via the main menu item
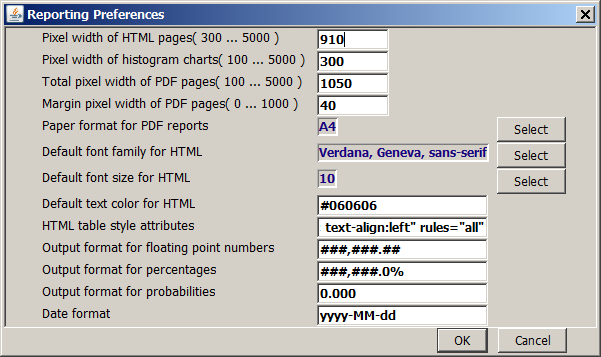
If the text sizes of the chart labels in the graphs within the generated reports are too small or too large, you should edit the preference setting 'default chart label font' in the preferences dialog
Once a report template has been defined within an Synop Analyzer project, it can be executed ('run') via the main menu item