|
||||||||
| FRAMES NO FRAMES | ||||||||
Purpose and short description
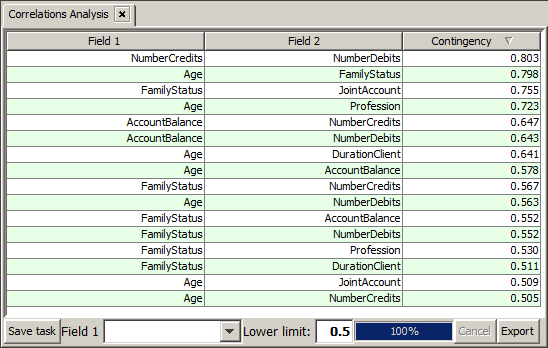
The tabular correlations view
The bottom tool bar
The correlations matrix view
The data exploration module 'Correlations Analysis' serves to get an overview over the dependencies and correlations between the different data fields within a data source. This is done by creating a table of field-field contingency coefficients.
The main part of the correlations analysis panel displays a table of field-field correlations. In the literature, there are many different definition of measures for correlation, for example the linear correlations coefficient (or Pearson's correlations coefficient) between two nummeric data fields. Linear correlations coefficients have values between -1 (strong negative correlation) and +1 (strong positive correlation).
In Synop Analyzer, we use another measure for correlation which can also be calculated for pairs of textual data fields, or for a numeric and a textual field: the so-called adjusted contingeny coefficient C as it is defined in http://en.wikipedia.org/wiki/Contingency_table. This quantity assumes values between 0 (=no correlation) and 1 (=maximum correlation). The contingency coefficient is stronly related to the bivariate value-value matrix of the two involved fields as it is created in the Synop Analyzer module Bivariate Analysis: if one creates a bivariate value-value matrix for two data fields such that the field with the higher number of different values is traced on the y-axis, then one can derive from this matrix
count=0 and one single intensively green colored cell per row.
In the following we show an example for a continceny table. The example uses the sample data
By right-clicking with the mouse on one of the rows in the contingency table you open a new Bivariate Analysis panel in which the two data fields which appear in the selected table row have been chosen as the x-axis and the y-axis field.
The tool bar at the lower border of the screen provides the following functions:

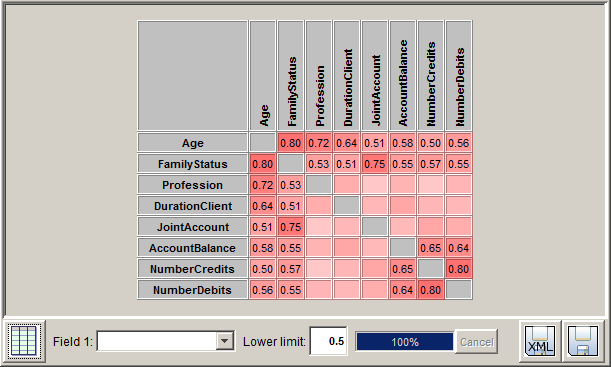
In the matrix view, all field-field correlation numbers are shown in a compact matrix representation. The cells' background colors are the more intense the higher the correlation is.
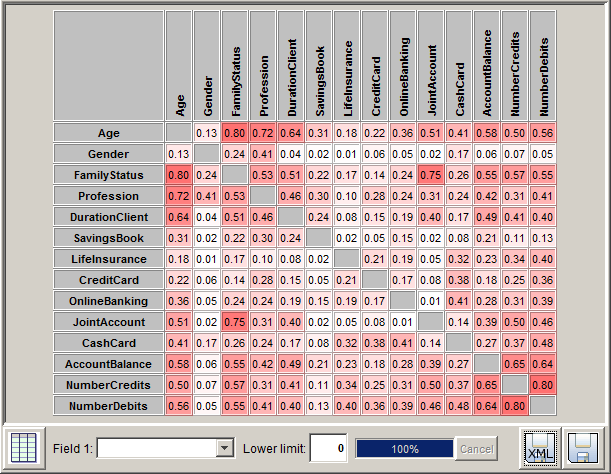
If one chooses a minimum contingency threshold larger than zero in the toolbar, all correlation values smaller than this threshold are removed from the matrix. If a data field has no correlation value above this threshold, the entire row and the entire column representing this field are removed from the matrix. This results in a more compact view which focusses on the highest correlations in the data.