|
||||||||
| FRAMES NO FRAMES | ||||||||
Purpose and short description
The tabular views
The histogram charts view
The bottom tool bar
Detecting and removing perfect tupels
The data exploration module 'Statistics and Distributions' is the easiest, most fundamental data visualization module of Synop Analyzer. The screen screen is vertically divided into two areas. The upper part contains some basic statistical measures and figures of each data field in tabluar form. The lower part shows the value distribution of each data field in the form of histogram charts. In summary, the purpose of the module is to give a quick overview over a data source which has been read into Synop Analyzer:
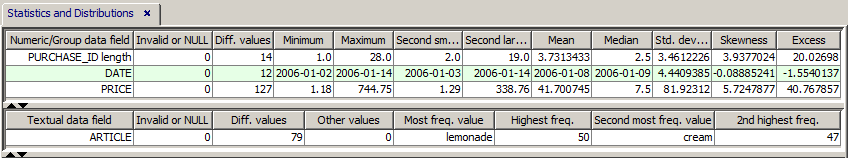
In the upper part of the module 'Statistics and Distributions' two tabular views display important statistical measures of the numeric and the non-numeric data fields. The screenshot below shows these tabular views for the data
The screenshot shows that the textual data field ARTICLE has no missing values, that it has 79 different values and that the value lemonade, which occurs in 50 purchase IDs, is the most frequently purchased article, followed by the article cream contained in 47 purchases.
For the numeric field PRICE we see that it has no missing/invalid values either, that the cheapest purchase was 1.18 $, the most expensive one 744.75 $, the average purchase value was 41.70 $ but 50% of all purchases were below 7.50 $. That means, there are many small purchases and a few very large ones. Accordingly, the distribution of purchase prices has a positive skewness (long tail towards high prices). A precise definition of the three measures 'Standard deviation', 'Skewness' and 'Excess' can be found on the following Wikipedia pages: Sample standard deviation, Skewness und Excess Kurtosis.
For group fields (in our example the field PURCHASE_ID, Synop Analyzer does not show a statistics on the field values - the field values of group fields are normally of little interest since they are only used to define groups of data records. Instead, a statistics and distribution of group lengths is shown, in other words: a statistics on how many data records are in the various data groups defined by identical group field values.
The lower part of the screen shows value distribution histograms for all data fields. Histograms with more than 40 bars cover the entire screen width, histograms with not more than 20 bars are grouped into tupels of N charts per screen row, where N is the number entered into the tool bar input field named
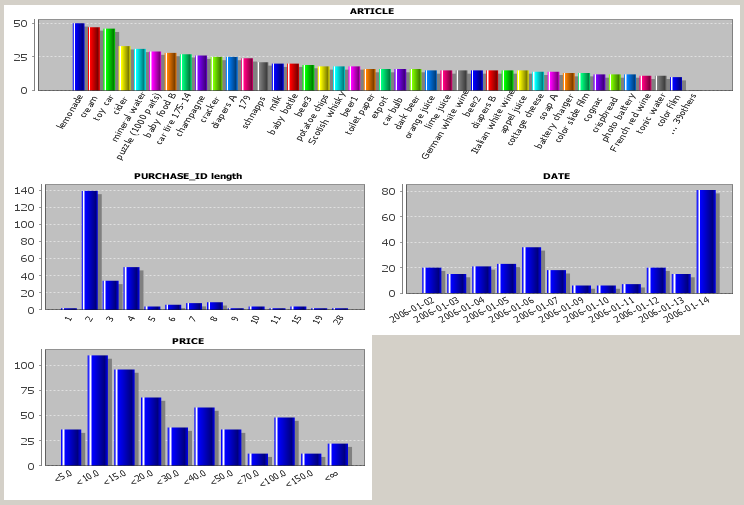
In the histogram charts for non-numeric data fields, the values are arranged by descending occurrence frequency from left to right. Each value has another bar color. If a data field has more then N values, where N is the number in the input field
In the histogram charts for numeric data fields, all bars have the same color, and the values or value ranges are ordered by increasing value from left to right. A histogram for a numeric data field has - unless a manual field-specific discretization has been defined - never more than n histogram bars, where n is the number entered into the input field
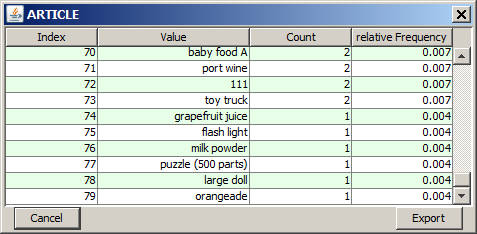
By left mouse click on a histogram chart you open a tabular detail view containing all different values of the field and their absolute and relative occurrence frequencies. This detail view also contains those values for which no separate bar could be drawn in the histogram charts due to lack of space. In the figure below, such a pop-up table view for the data field ARTICLE is shown.
By drawing with the mouse (keep the left mouse button pressed while moving) on a histogram chart you mark a rectangular region in which you want to zoom in.
By right-clicking on a histogram chart you open the pop-up dialog shown below. In this dialog, you can modify the appearance of the histogram chart (text fonts and sizes, axis styles, labels, etc.) via the menu item
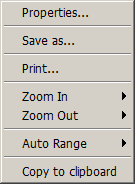
Using the button
The tool bar at the lower screen border provides the following buttons and functions:

The detection of 'perfect tupels' is started by clicking on the tool bar button
In the following we want to demonstrate this using the sample data
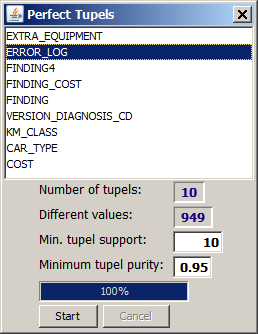
We choose the field ERROR_LOG and accept all other default settings in the window: search for value tupels whose single values appear in at least 10 data groups and for which at least 95% of the data groups which contain one single value out of the tupel also contain the entire tupel. Then we press the
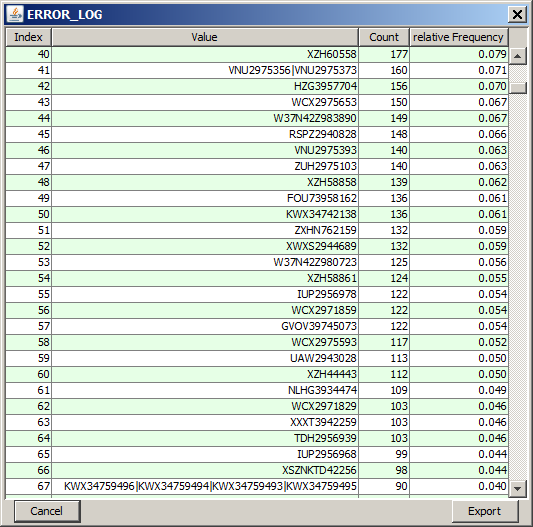
The screenshot printed above already shows the appearance of the window after the start command has been executed. 10 perfect tupels were found. The values forming these tupels were eliminated from the data, and whenever all values forming a tupel wer found in a data group, the tupel was inserted as a new single value into that data group. After replacing the single values by the tupels, there are 950 remaining different values in the field ERROR_LOG.
One can examine which values have been replaced by closing the 'perfect tupels' dialog and left-clicking on the histogram chart for the field ERROR_LOG: when scrolling through the value list we find new, longer error log codes which contain the concatenation character '|'. , for example the tupel of length 4 composed of the values KWX34759496, KWX34759494, KWX34759493, and KWX34759495. This tupel occurs in 90 repair cases.