|
||||||||
| FRAMES NO FRAMES | ||||||||
Purpose and short description
The result view
Obtaining correction hints
The bottom tool bar
Specification of the desired content of the deviation patterns
Modification of the statistical limits and settings
Detailed introspection of selected deviation patterns
Saving and exporting results
Interpretation of deviations: untypical data set or data error?
In the Deviation Detection panel, outliers, deviations and presumable data inconsistencies can be detected. The specific approach of this module is that it does not examine the values and value distribution characteristics of each data field separately for outliers as traditional data quality checker tools do. Rather, it finds cross-field inconsistencies.
For example, in a customer master data table neither the value Age=35 nor the value FamilyStatus=child is an outlier or deviation, but the combination of both is one. This type of data errors are often overlooked by other data quality tools.
The deviations and inconsistency detection module was designed for usability for non-statisticians. It aims at delivering interesting results and findings without obliging the user to define hypotheses, busines rules or filter criteria and without too many 'expert' parameters and options. In the following, we are going to demonstrate a typical usage scenario of the module by means of an example analysis of the sample data
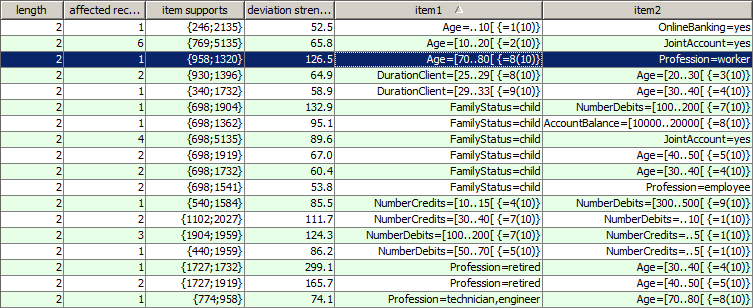
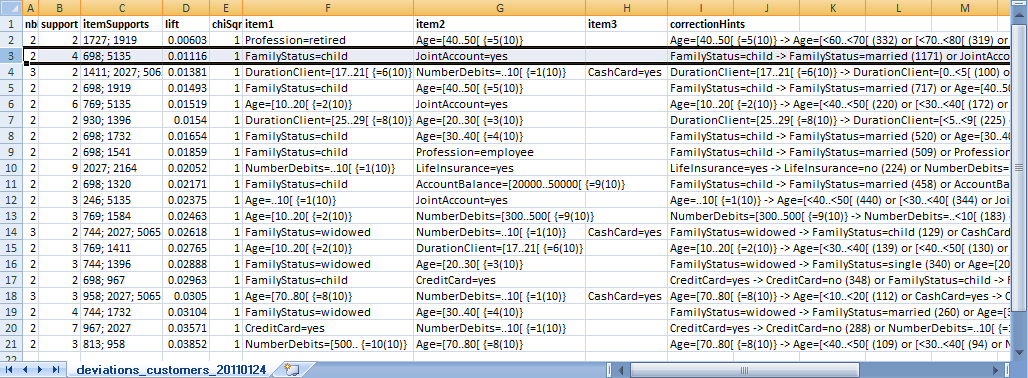
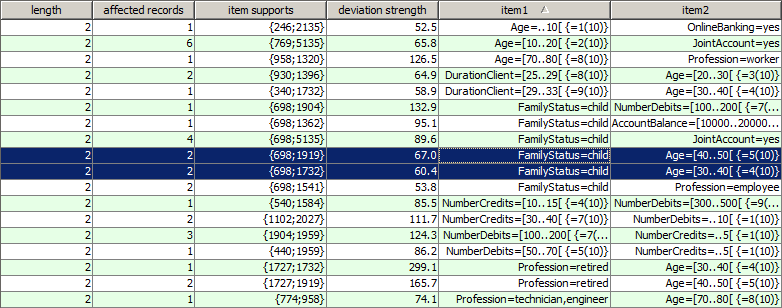
(Note: in the picture shown above, we have mouse-clicked the table column header of the column
Hence, the deviation pattern which has been highlighted in blue in the above picture can be interpreted as follows: the combination of the two items Age=[70 to 79 years] (which is the 8th out of 10 value ranges of the date field Age) and Profession=Worker appears in one single data record. As the range Age=[70 to 79 years] appears in 958 out of 10000 data records and the value Profession=Worker in 1320 data records, we expected a much higher occurrence frequency, namely with about 958/10000 * 1320 = 126.5. That means, the lift value of the pattern is 1/126.5. The difference between the observed frequency of 1 and the expected frequency of 126.5 is highly significant (χ� confidence=1.000). The combination of the two, the confidence divided by the lift, is the deviation strength of the pattern (126.5).
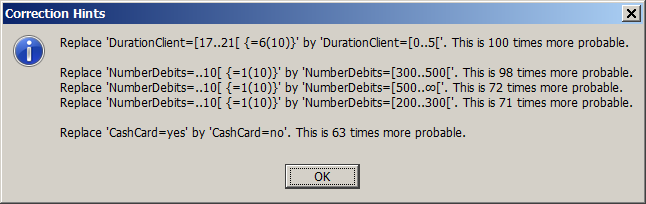
Some detected deviation patterns might be evident such as the pattern Age=[30 to 49] andFamilyStatus=Child. In many other detected patterns, however, it might be unclear which part of the pattern contains the part which does not fit with the rest of the pattern, and what replacement would most probably 'heal' the inconsistency or remove the data error. Synop Analyzer helps answering these questions by providing a 'correction hint' feature: richt-clicking on one of the patterns listed in the patterns table opens a pop-up window in which the software indicates which parts of the pattern are most probably the deviating parts and what are the statistically most probably corrections. The following picture shows the correction hint for the pattern which has been highlighted in the preceding screenshot:
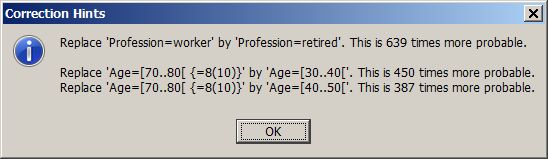
The single correction hints displayed in the pop-up window are ordered by descending statistical plausibility. In the example shown above, the correction hint says that it would be normal if a person at an age of more than 70 years was not a worker but a pensioner. The second most plausible correction would be that the age of a person who has the profession 'worker' was between 30 and 50 years.
Often, it is advisable to check the displayed correction hints by looking at the involved data records. Then it often becomes obvious which one of the suggested corrections is the best matching one - or whether no corrections should be applied because the inflicted data sets are somehow untypical but not erroneous.Our example of the worker above 70 years occurs in one single data record:
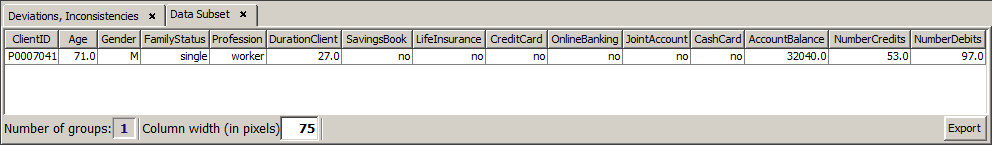
The closer inspection of this data set shows that most probably the value of the field Profession is outdated. The duration of the client relationship, the lack of adoption of 'modern' bank services (online banking, credit card, bank card) combined with an above-average account balance are more typical for a 71-year-old pensioner than for a younger worker.
The tool bar at the lower edge of the panel provides features for
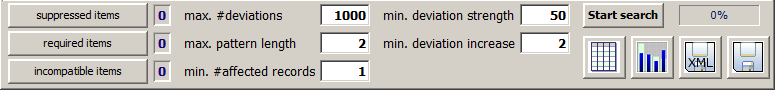
In the following we will describe these three groups of features in more detail.
The three buttons at the left end of the tool bar help to focus the deviation detection to patterns with a user-specified content. Three kinds of specifications can be performed.
Using the button
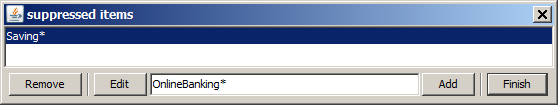
In the screenshot below we have alredy specified that nothing involving the term Saving (as part of a field name or field value) should appear in the detected patterns. Then we have specified that we also want to suppress all patterns in which the term OnlineBanking occurs. This second limitation has not yet been activated by pressing the
Using the button
Using the button
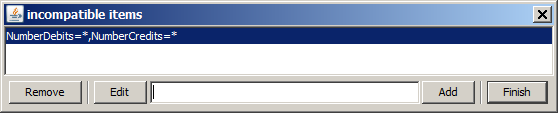
In the screenshot below we have specified that we do not want to find deviations which simulataneously contain values from the data fields NumberCredits and NumberDebits
The blue number fields at the right of the three aforementioned tool bar buttons indicate how many restrictions of the respective type have been defined and activated.
The five numeric input fields in the middle of the tool bar serve to specify desired value ranges for five statistical measures of the patterns to be detected:
The preceding picture shows an eample in which the predefined value of all five input fields has been modified. Additionally, the item content restrictions described in the preceding section have been maintained. Using these settings, Synop Analyzer finds the following deviation patterns:
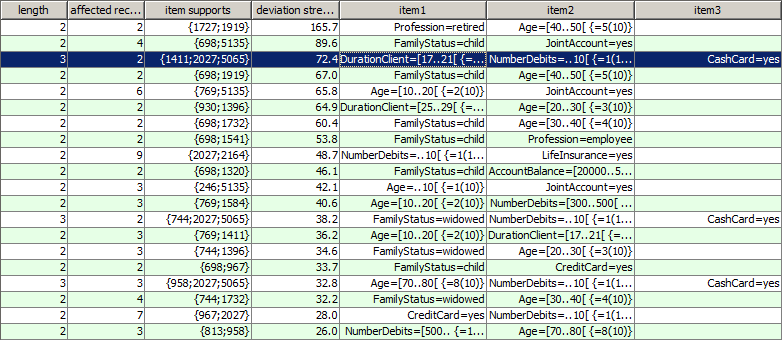
Compared to the patterns created using the default settings, we notice that we now find some patterns of length 3. For these longer patterns, the 'correction hint' feature is often particularly helpful: the longer a pattern is, the more difficult is it to understand which part of the pattern does not match with the rest. In the screenshot below we show the correction hint for the pattern which has been highlighted in the picture above.
From the correction hints we understand what makes this pattern a deviation: long-term inactive (nominal) clients should not have an active bank card. The item BankCard=yes is the one which does not fit into the rest of the pattern.
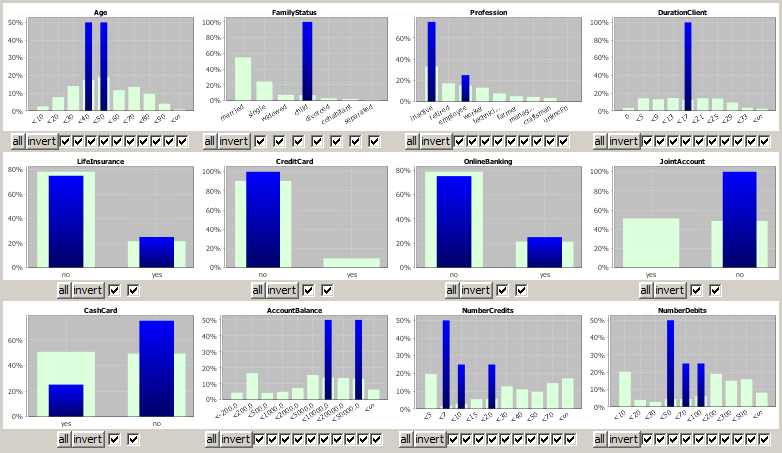
Another possibility of deviation pattern introspection is to compare the properties of the data records which are affected by the selected pattern(s) to the entire data. This can be done using the multivariate exploration technique known from the module Multivariate Exploration, but with the affected data records as fixed preselection. By deactivating some of the checkboxes below the histogram charts you can further reduce the data selection.
This function is provided via the button
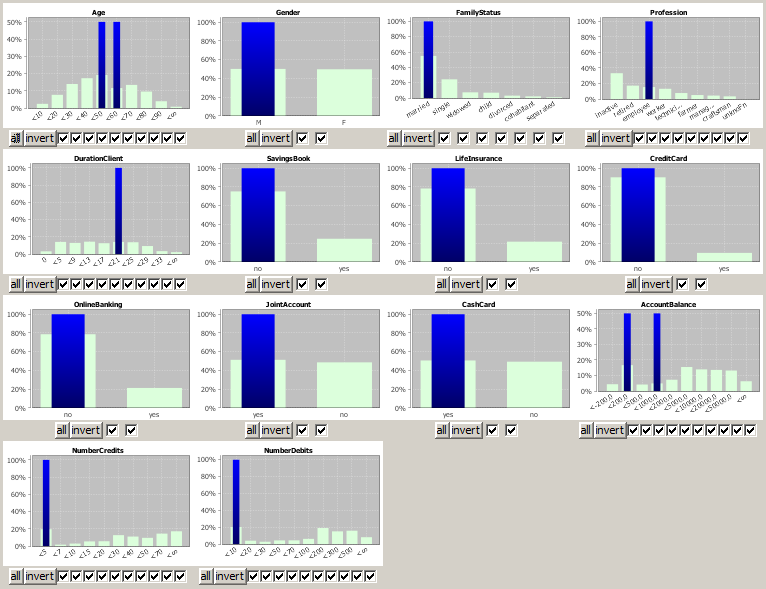
We notice that the affected customers are mainly married male employees between 40 and 60 years which are long-term customers and have a joint account and a bank card. This is a very normal, unremarkable combination. More noticeable is the fact that their accounting activity (NumberDebits and NumberCredits is close to zero, which is quite untypical for this customer group.
Our preliminary result is that the examined pattern does probably not indicate data errors: apart from the accounting activity, all demographic data properties of the affected records are consistent. The question now is which of the involved customers are purely nominal clients which should be removed from the customer master data because they generate negative margins, and which customers could and should be 'reactivated'.
In order to answer this question, we use another tool bar function: the button
Note: A table of the affected data records can also be opened from the multivariate exploration pop-up window by clicking on the button
If only the one pattern of length 3 has been selected which has been discussed above, the tabular data records view looks as follows:

From this introspection we understand that the second customer, P0034770 probably belongs to the category 'nominal client': during one year, the customer had no credit transaction and only one debit transaction, probably an account-keeping fee so that the account balance has slipped into the slightly negative range. This customer generates most probably more cost than profit, and a 'reactivation' is highly improbable.
The first customer, P0031522, on the contrary, shows some financial activity on his accounts. Here, trying to reactivate the customer might be more promising.
At the end of a data analysis one often wants to permanently save the analysis settings, or to export the analysis results so that they can be used outside of Synop Analyzer. The tool bar of the module
The module 'Deviations and Inconsistencies' shows data records and patterns which are significantly untypical. If the module is used for data quality monitoring purposes, two questions have to be answered for each detected pattern and each affected data record:
The module contains a couple of tools for answering these questions - the correction hints, the multivariate exploration and the data record introspection which have been described in earlier sections of this chapter. However, it should be noted that the correction hint can be misleading in some situations, and an automatic data correction process based on these correction hints and without further human controll is not advisable.
After this initial remark we want to revisit two of the examples discussed above. In these examples, a human introspector quickly understands that they must be data faults:
Since children of more than 21 years do not exist in any country on earth, we are faced with the question which values are faulty in the affected data sets. In order to answer this question we first look at the multivariate exploration of the four data records in which children of more than 21 years appear. From this graphical data exploration one often gets hints on where the data fault is located, for example could all affected data records carry one identical data import time stamp or they could stem from one identical source system or one filiation etc.
In our example, we get the impression that the four customers show rather a typical adult behaviour than a typical child behaviour (see the fields DurationClient, AccountBalance or NumberCredits. Now we introspect the data records themselves:
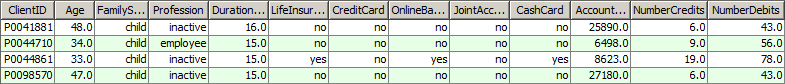
The first impression is consolidated: in each single data record we find three to four indications for the person being an adult (see Profession, AccountBalance, BankCard, NumberCredits). As a human processor we could now delete the four values FamilyStatus=child and either replace them by unknown or send the data records to a colleague who gathers the correct family status data.